The Perfect Plate – 2024 June & Q2
Every month, we’ll provide updates on the latest trends in the restaurant industry. We’ll include financial insights, charts, and public market comps
We wanted to share a direct analysis from the National Restaurant Association [NRA] for this report, which shows how overall traffic growth and real sales growth flattening in 2024.
Economic Update: Guest Traffic Sales are Declining
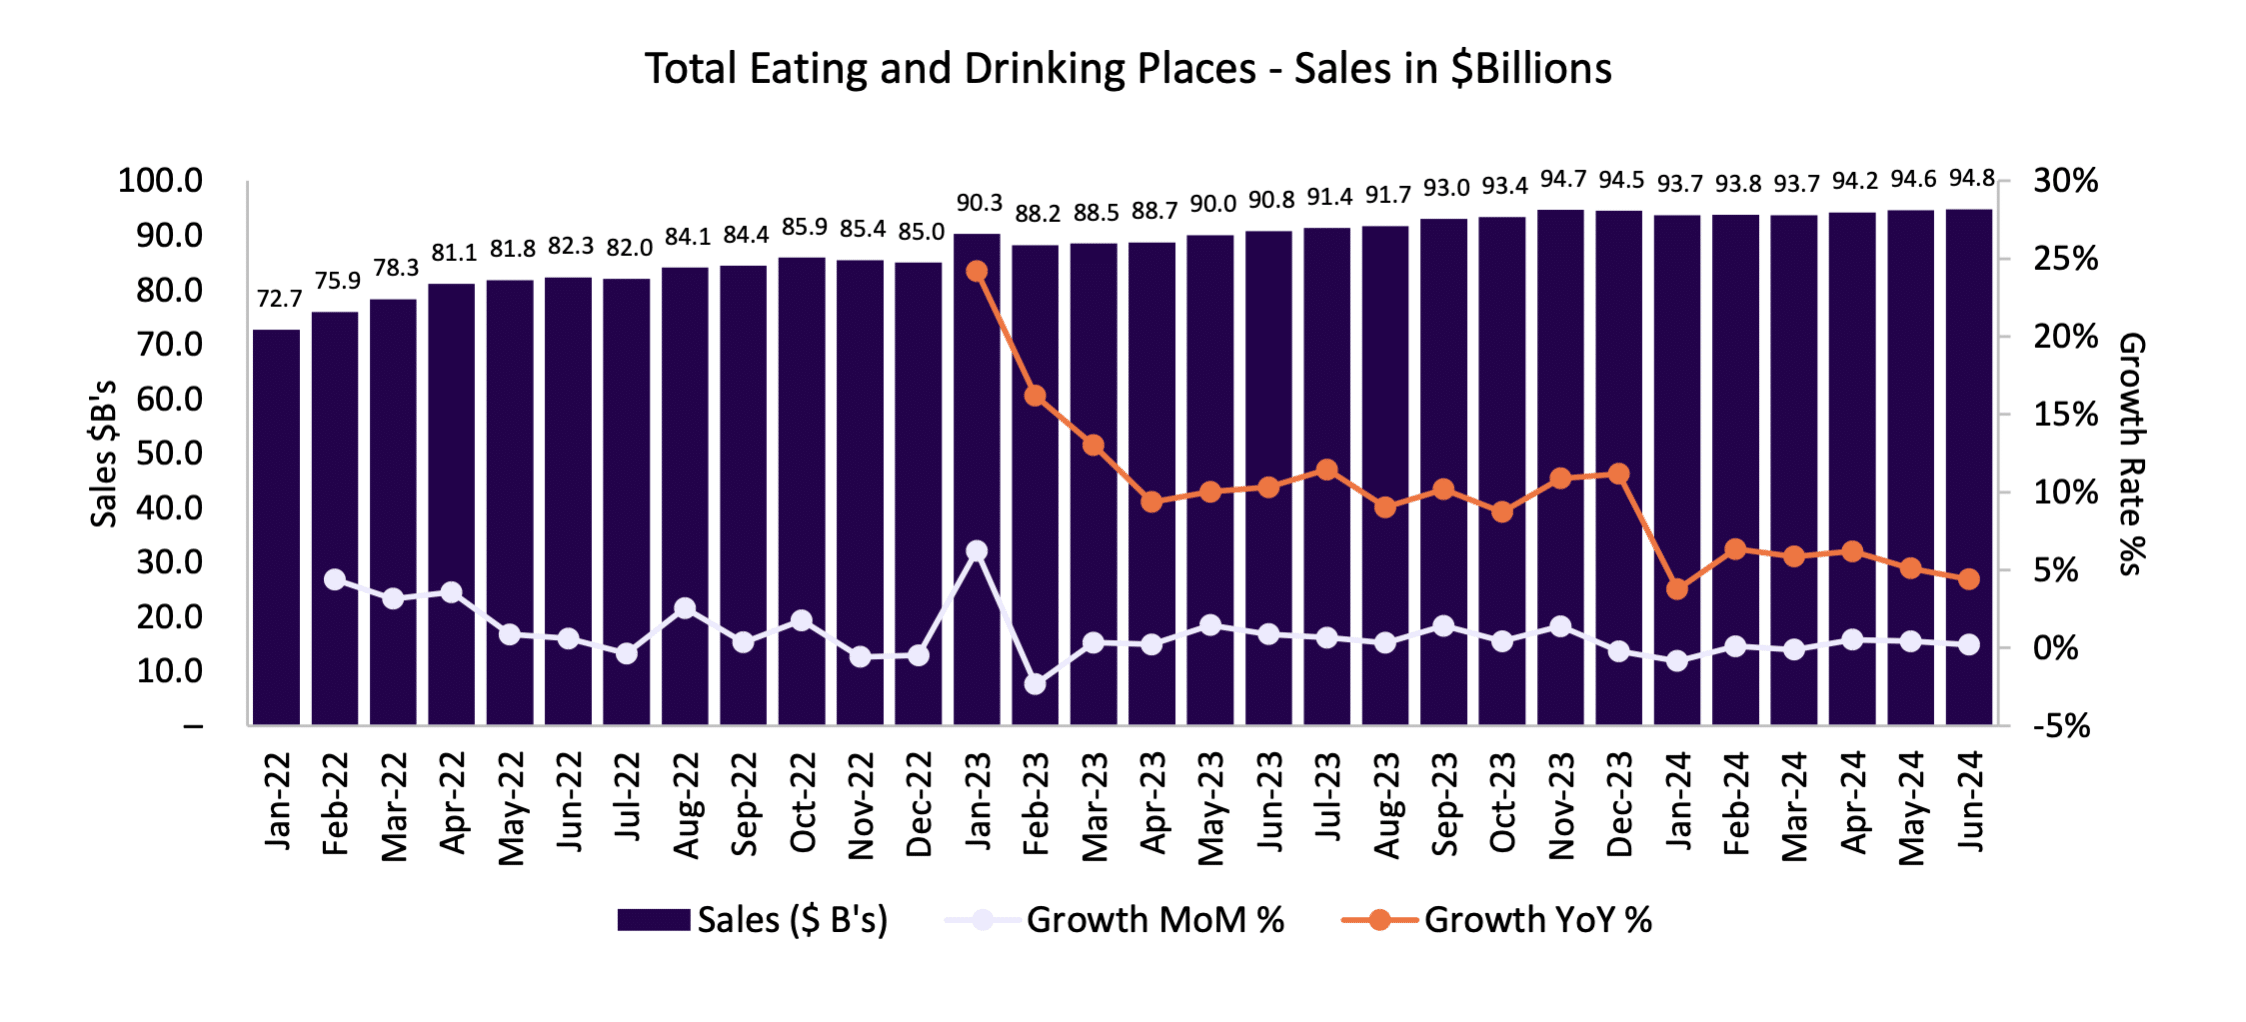
Eating and drinking places registered total sales of $94.8 billion on a seasonally adjusted basis in June, according to preliminary data from the U.S. Census Bureau. That was up 0.3% from May and represented the third consecutive monthly sales gain, after May’s preliminary reading was revised significantly higher.
While the trendline during the first half of 2024 was only modestly positive, the revised data paint a much more positive picture than was originally reported last month. Coupled with the continued resiliency of the labor market, this makes it likely that consumers will bend but not break during the second half of the year.
Source: National Restaurant Association, U.S. Census Bureau
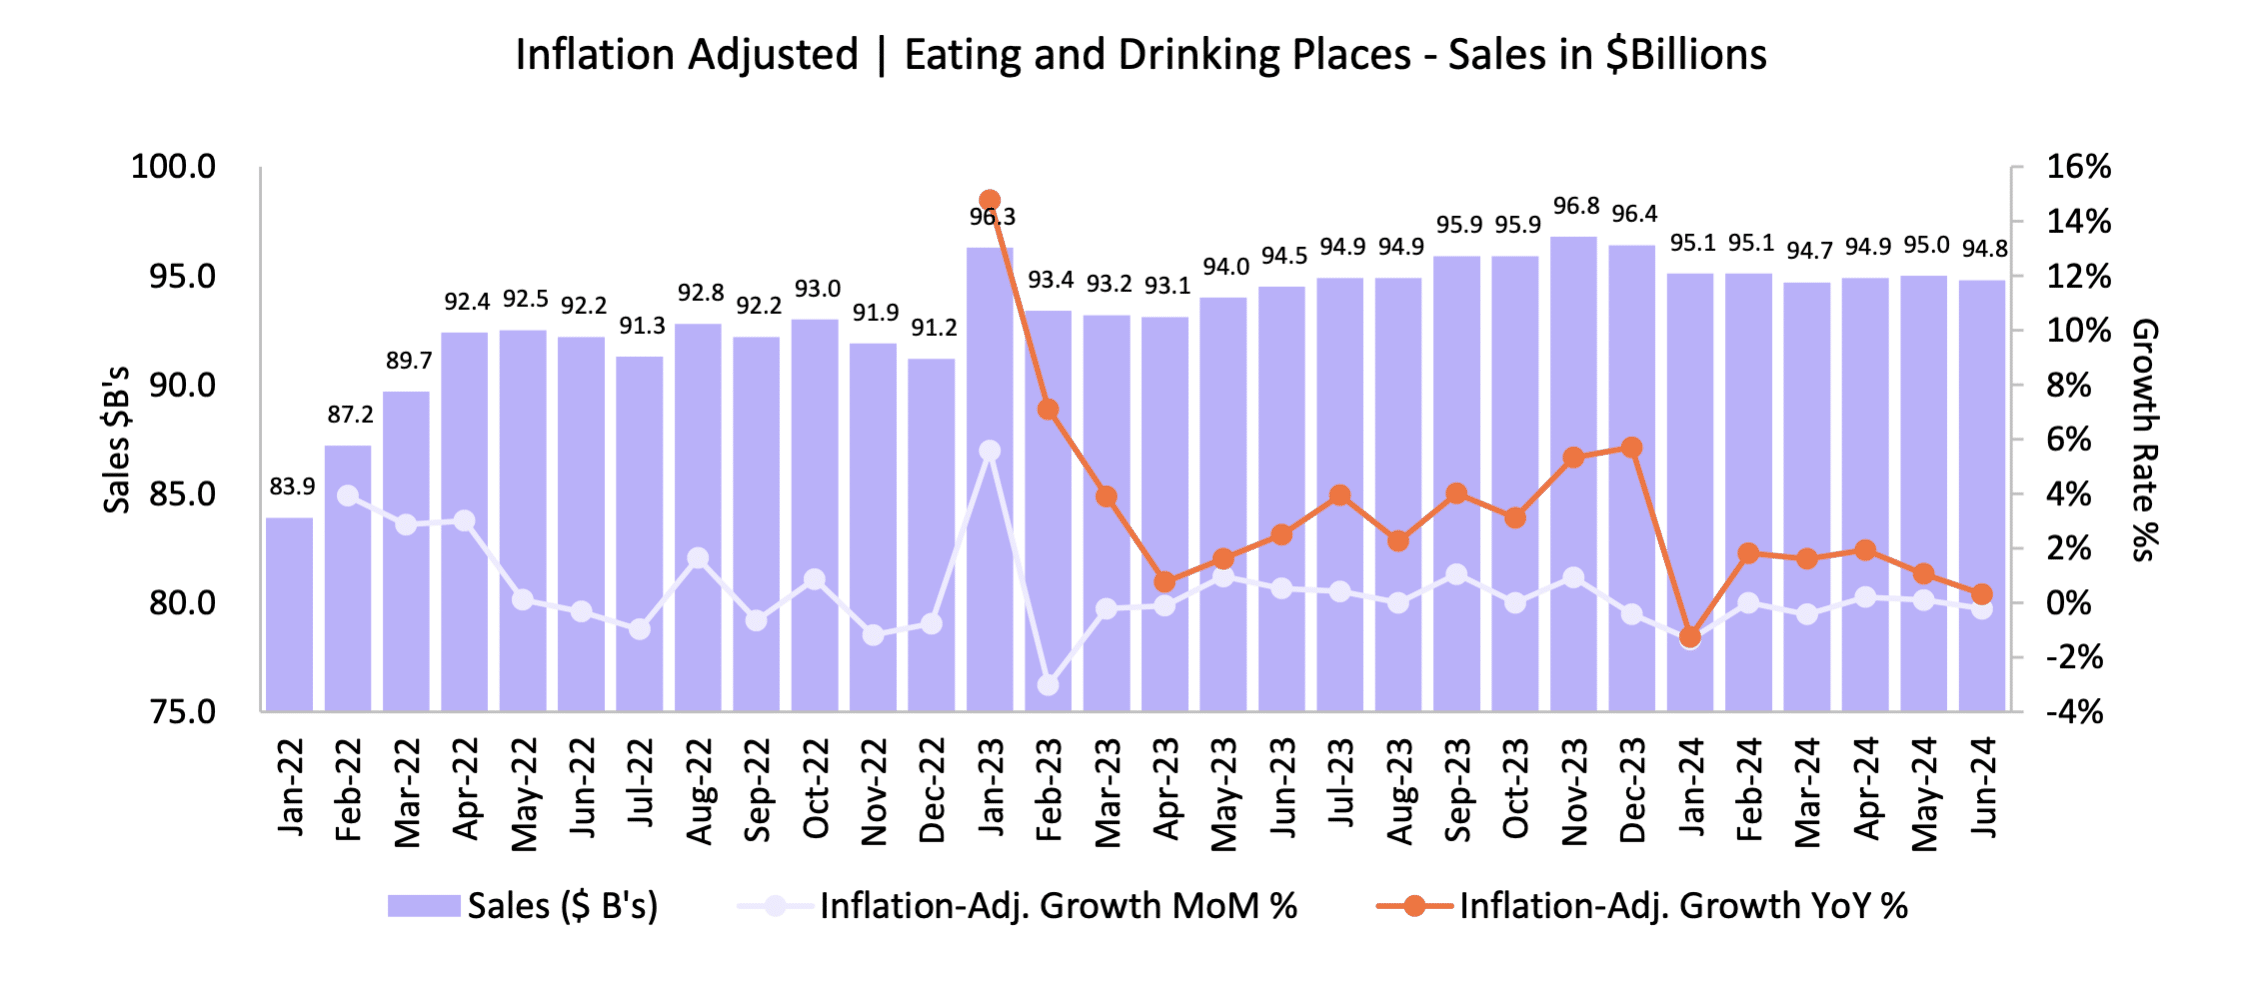
The recent uptick in restaurant sales was primarily driven by rising menu prices. As a result, real eating and drinking place sales were essentially flat during the first half of 2024, after adjusting for menu price inflation. Overall, June’s sales volume of $94.8 billion was a full $2 billion below the November 2023 peak, in inflation-adjusted terms.
Source: National Restaurant Association, U.S. Census Bureau
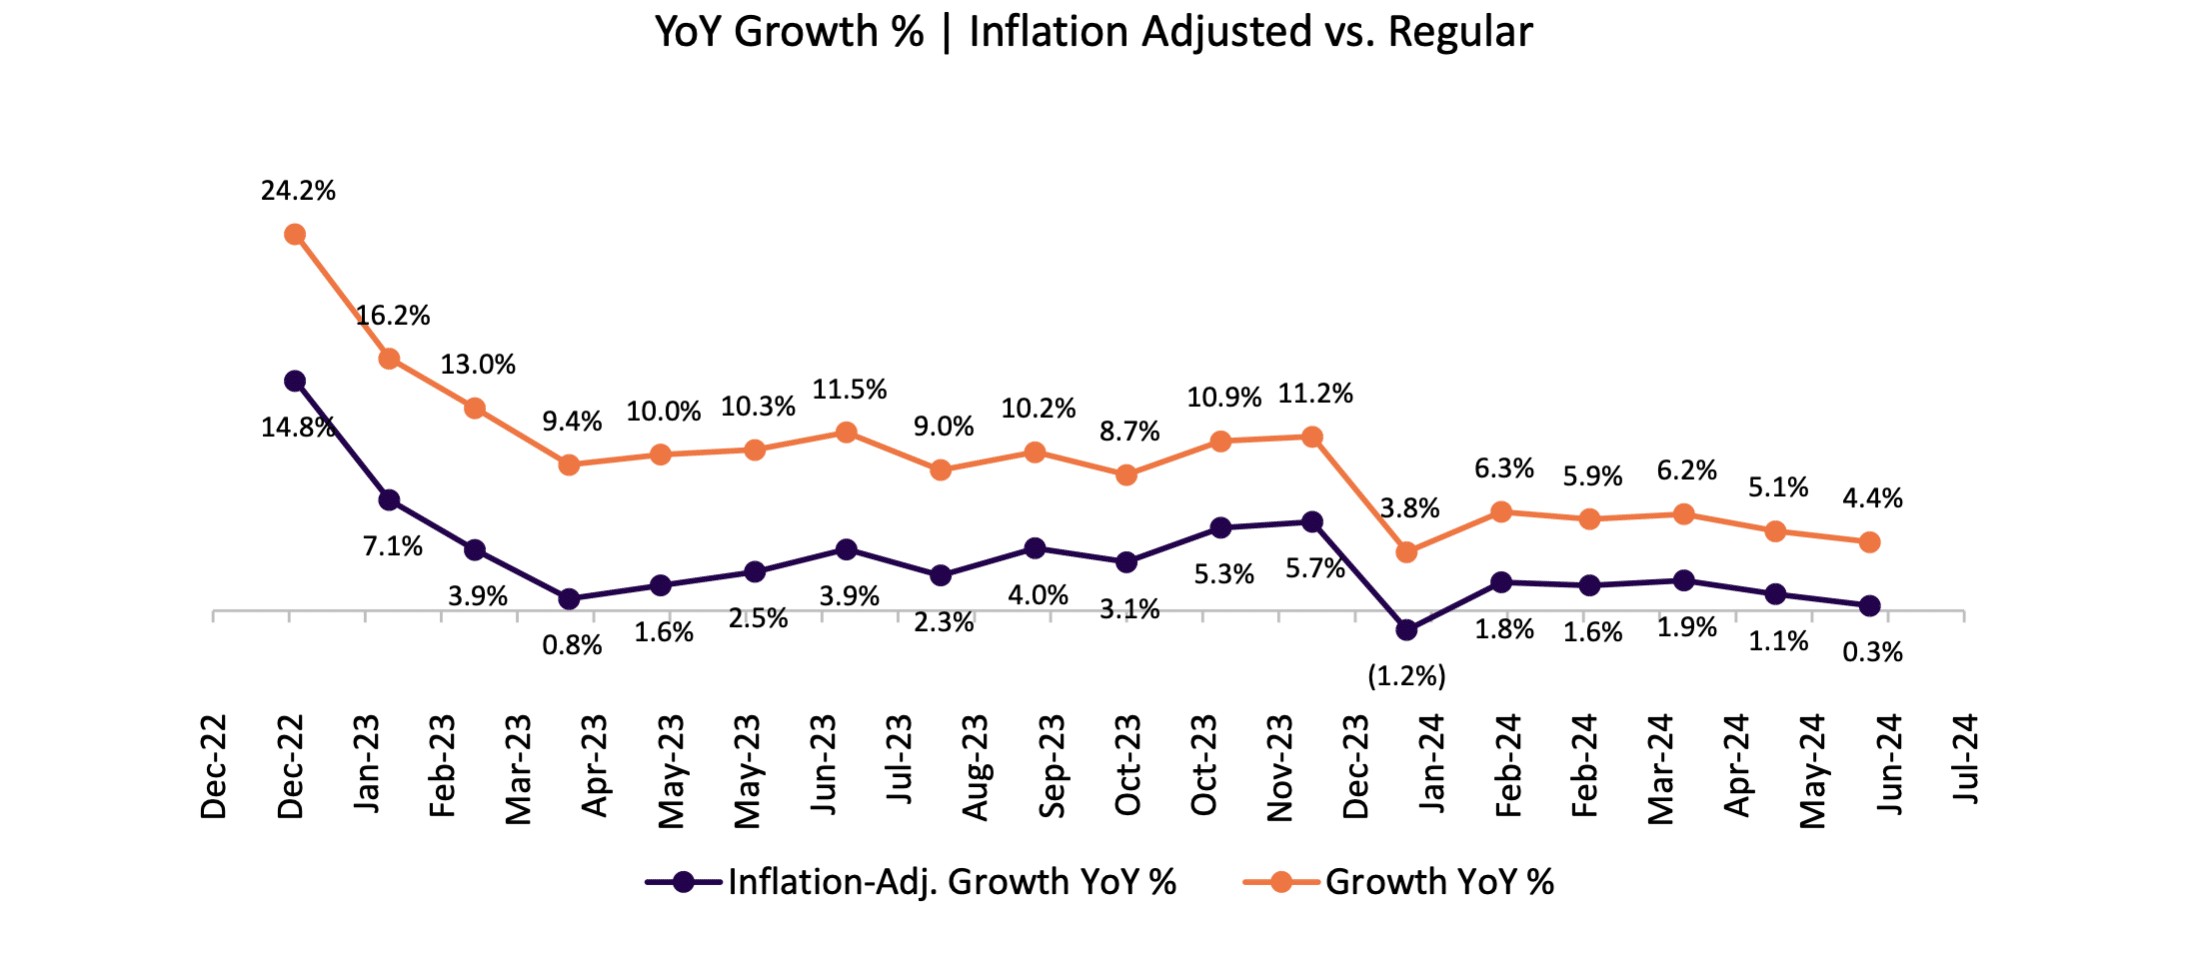
Here is a view of the spread between real and nominal growth rates. Data shows that in June 2024 the spread is 4.1% compared to June 2023 where it was 7.6%. Now that most concepts have increased menu prices; a focus needs to be shifted on increasing avg. check strategies or margin optimization.
Public Market Top 10 for the Week
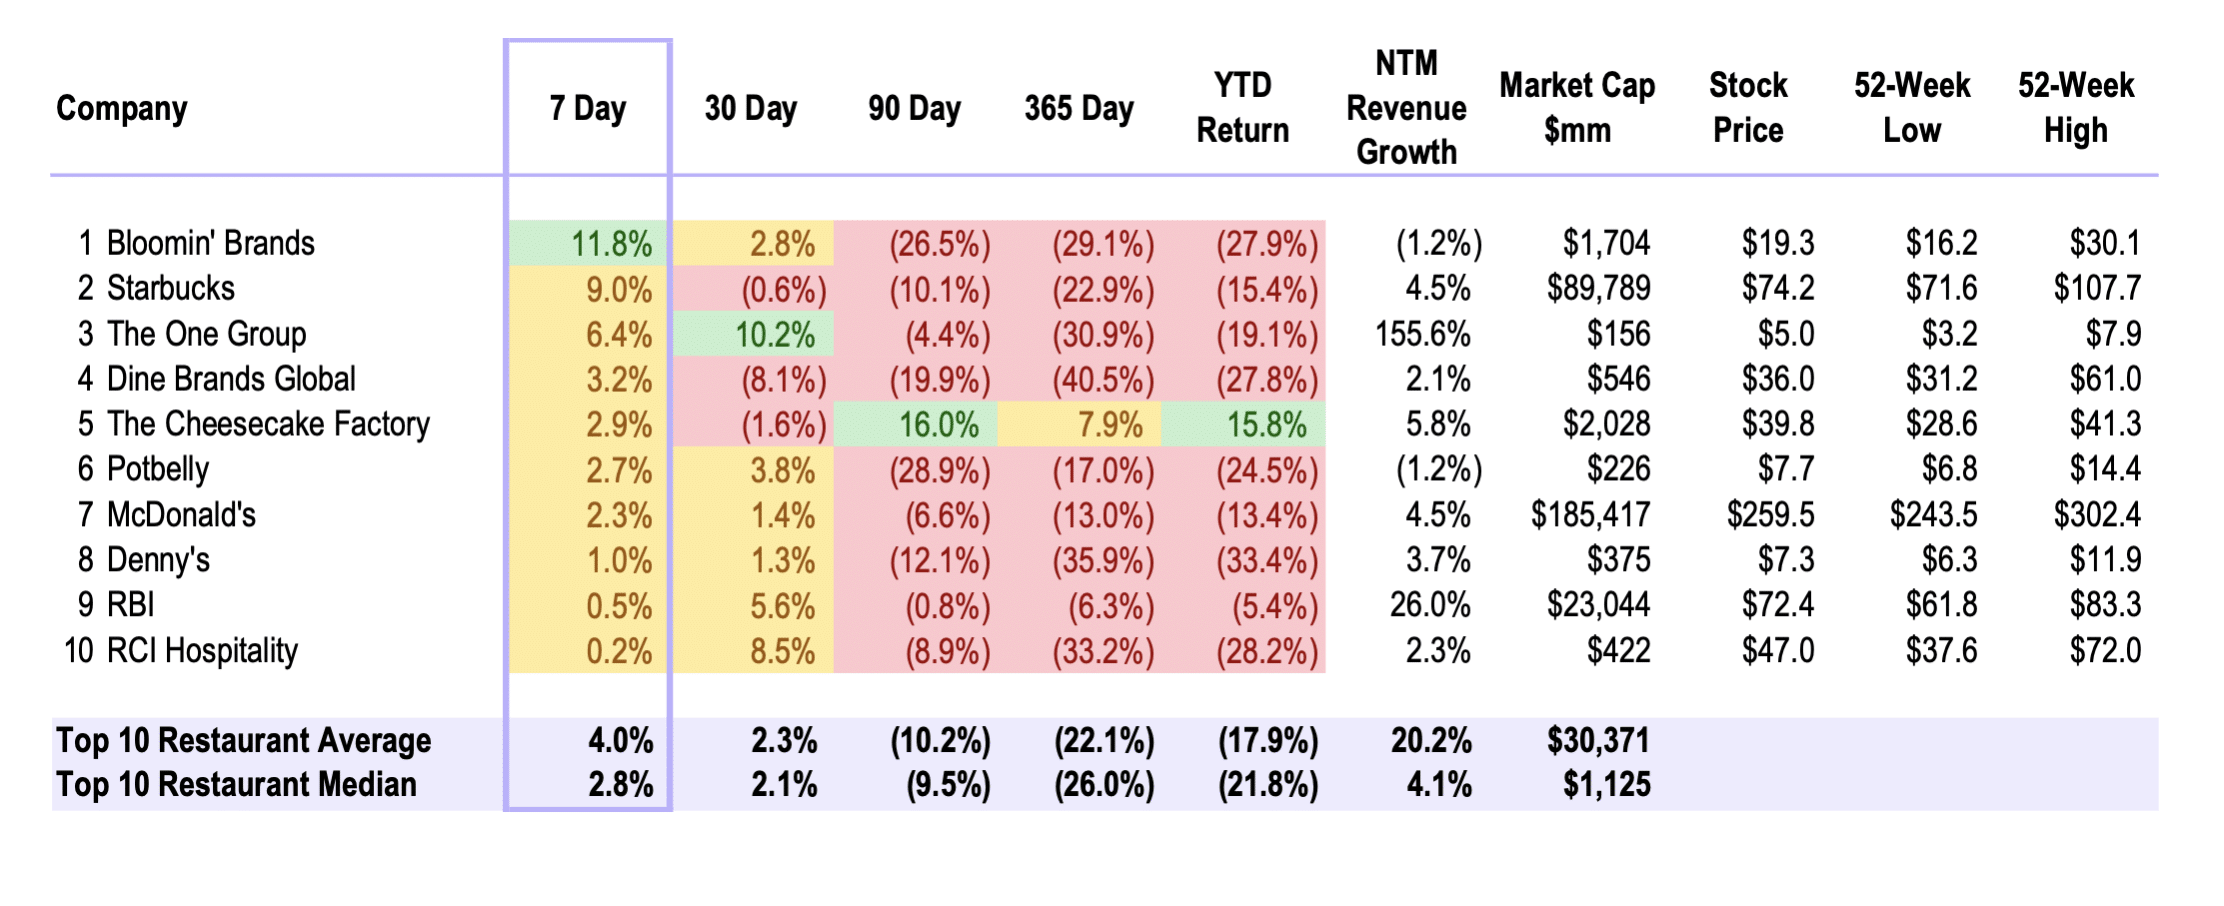
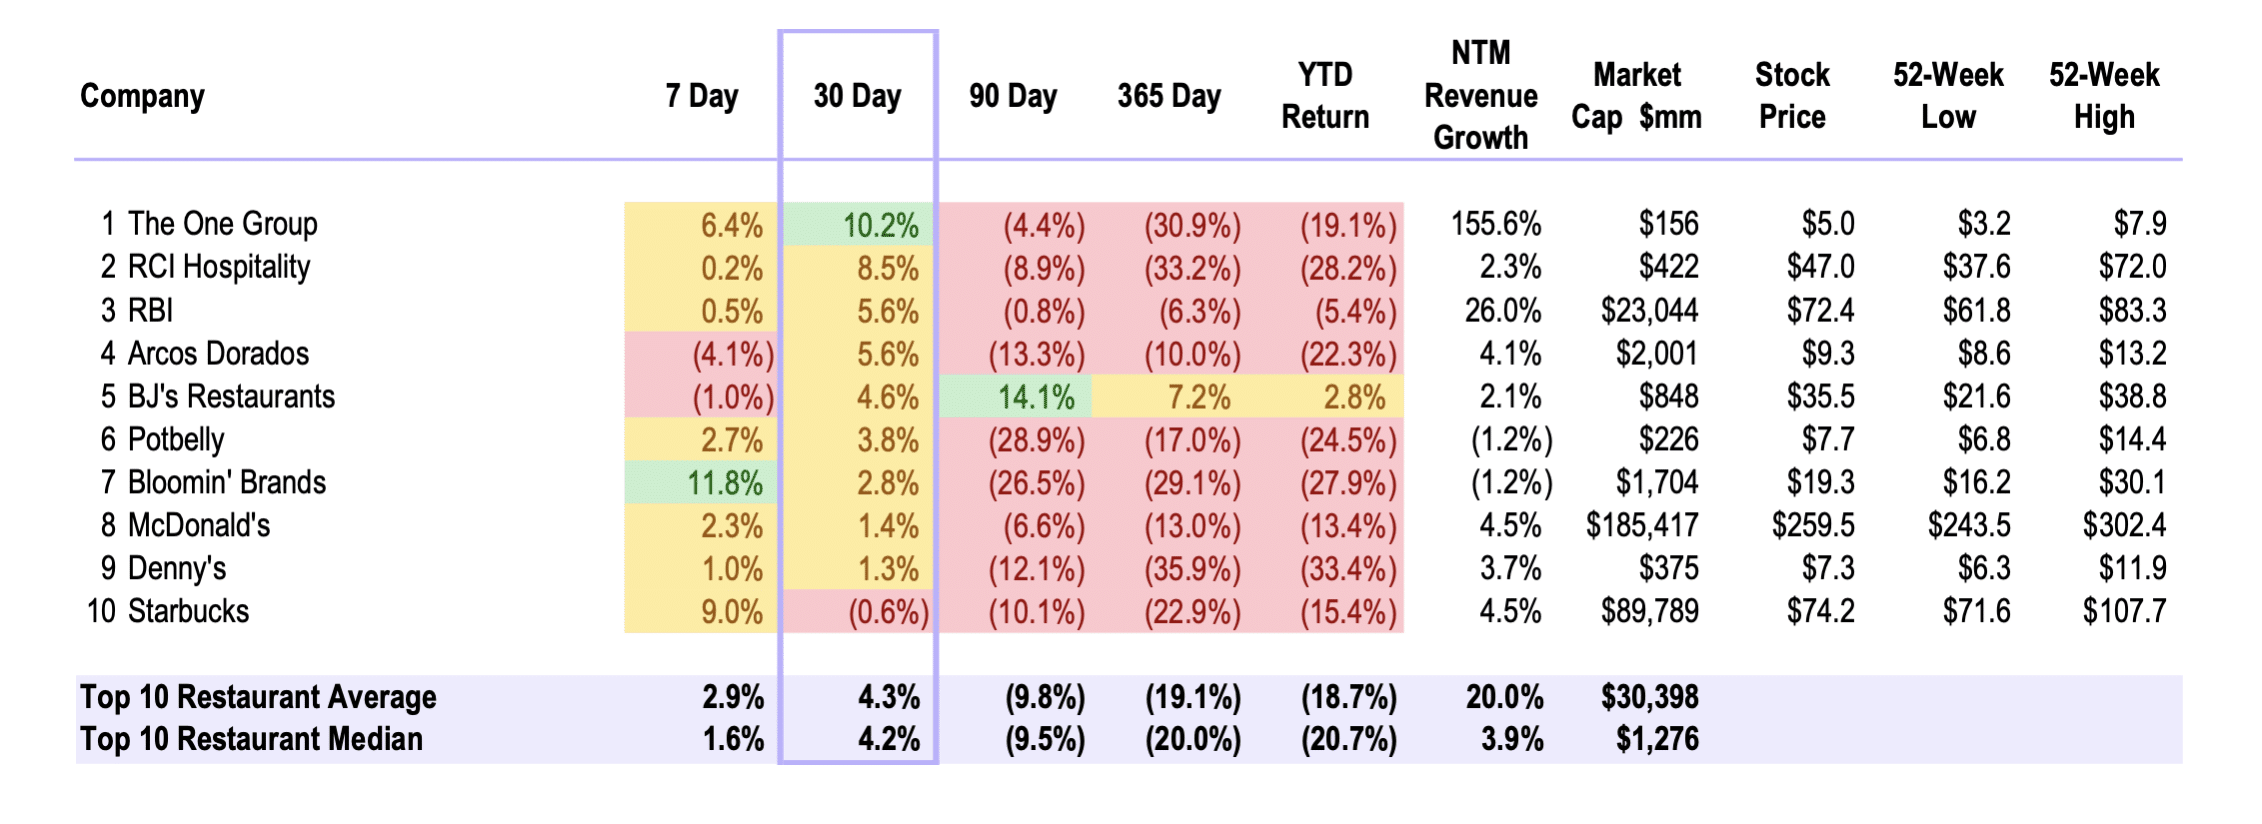
Bloomin’ Brands leads the top 10 for the week ending June 28th, 2024.
Stocks that have performed worse over the last year rebounded slightly over the last month.
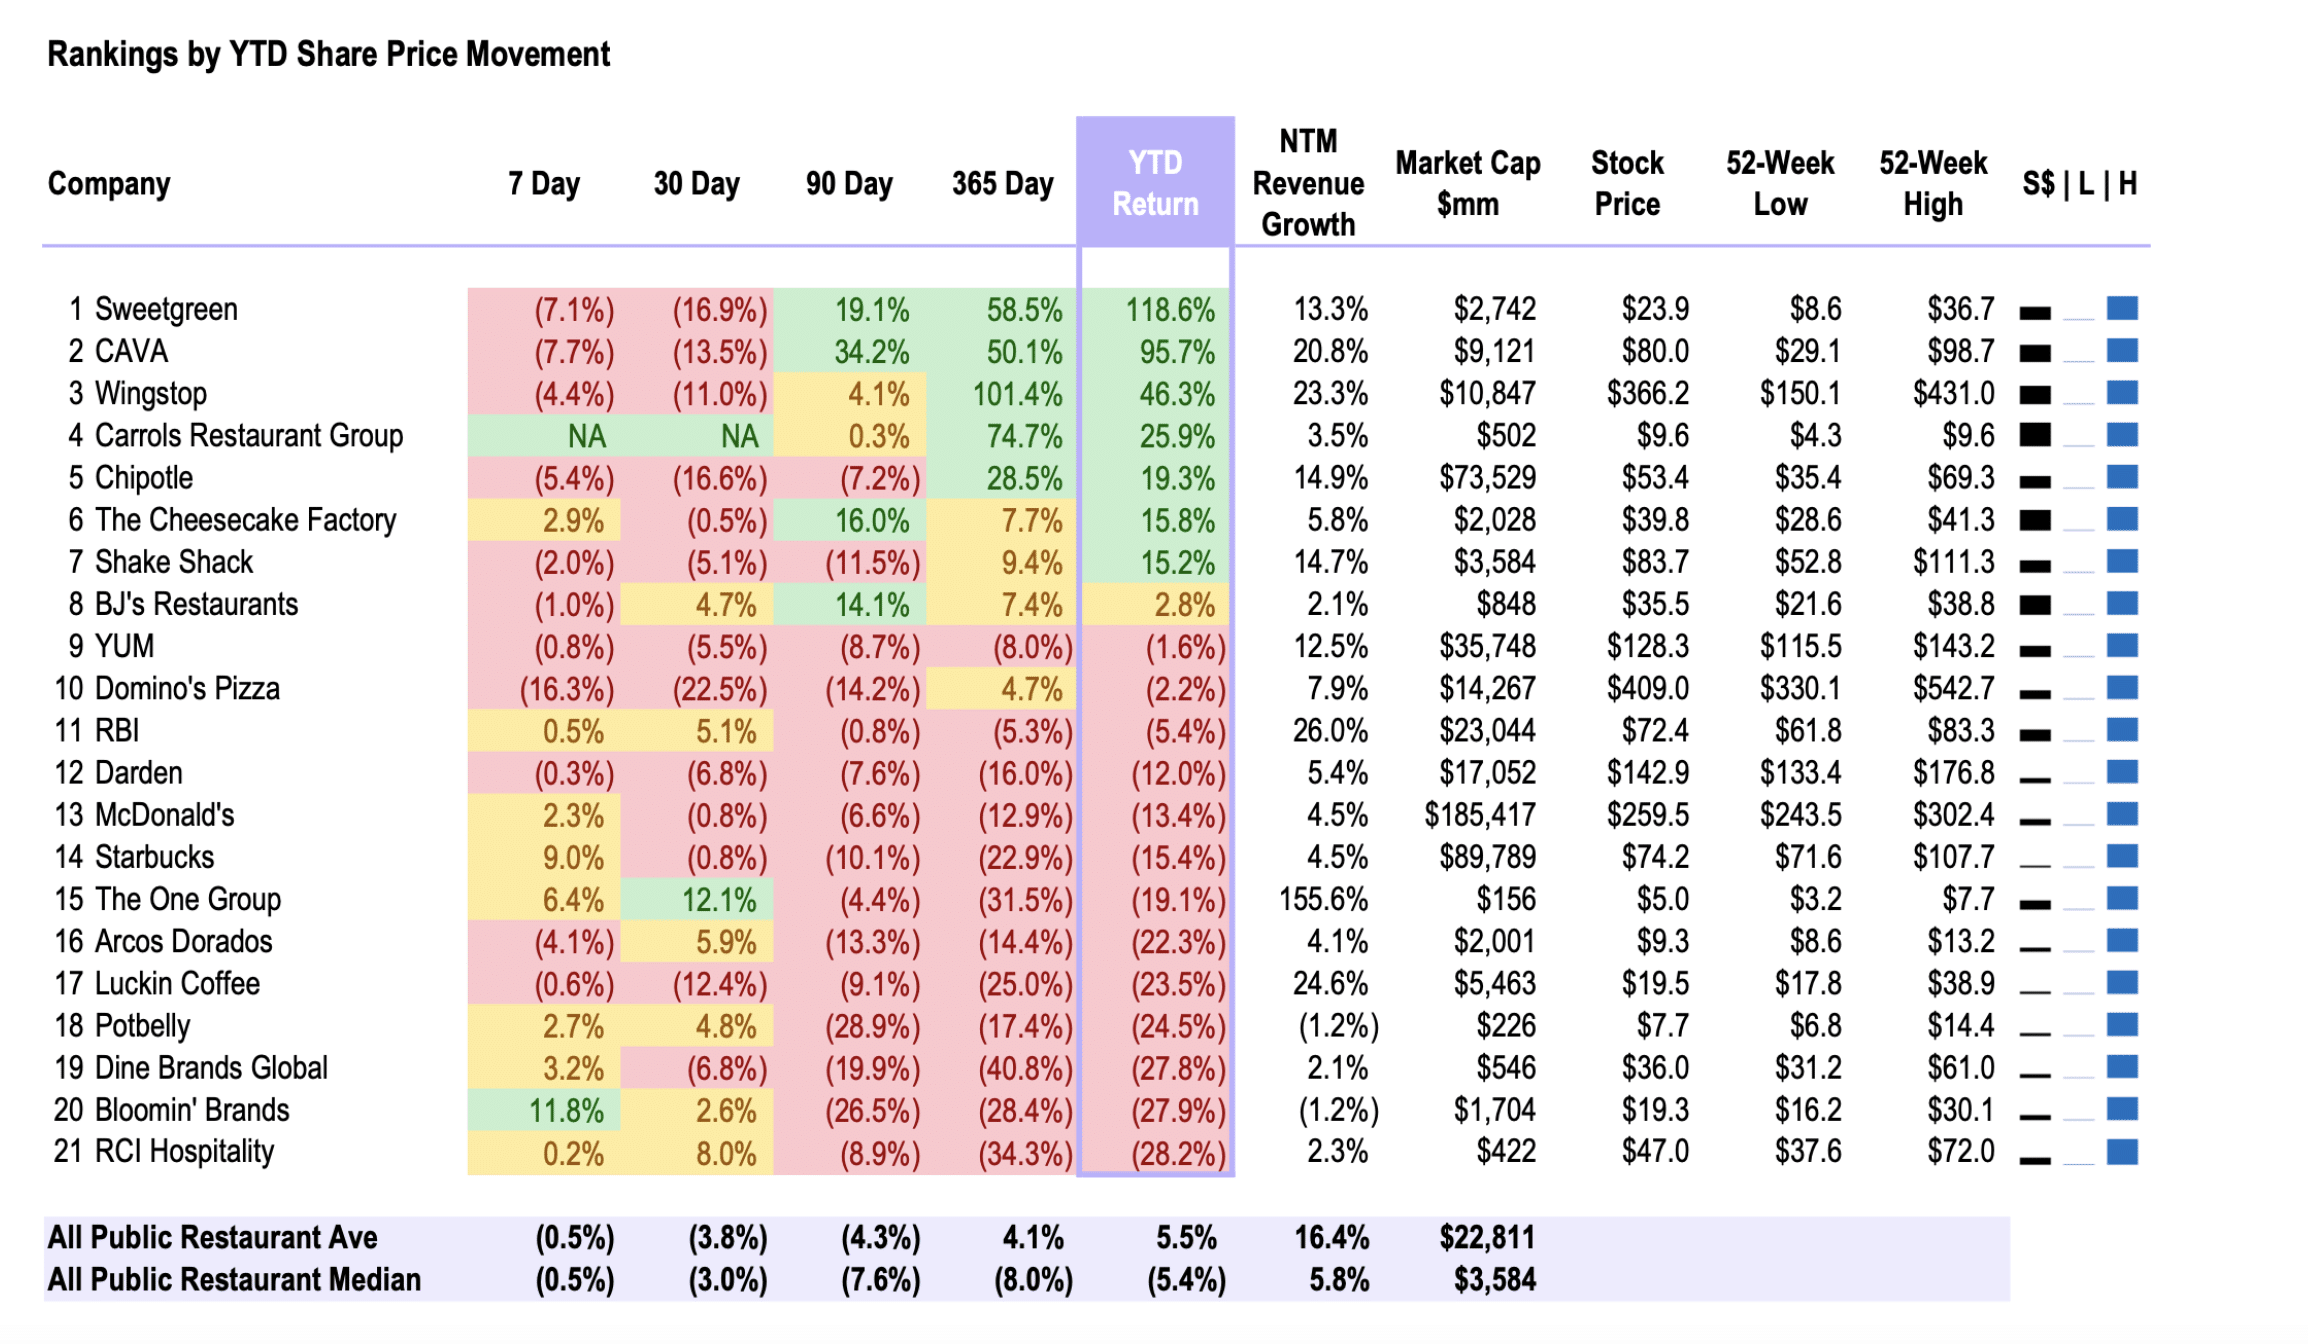
Public Market Summary for YTD Returns
Our Top Article Choices
- Restaurant Dive – One Table Restaurant Brands files for Chapter 11 bankruptcy protections – Link
- McKinsey Throwback – A recipe for restaurant revenue and sales growth. – Link
- Restaurant Dive – Cost pressures June drive restaurant franchisee bankruptcies in 2024 – Link
- Nerd Wallet – 2024 State of Consumer Credit Report – Link
Deal Making: Transaction Activity
M&A in 2024 Q2
- STK parent One Group completes acquisition of Benihana for $365M – Link
M&A in 2024 Q1
Market Update: Public Comps
Week Ending | 28/06/2024
Top 10 Monthly Price Movements
The last 30-day performance has had an average of 4.3% for the Top 10.
Source: TIKR, Paperchase
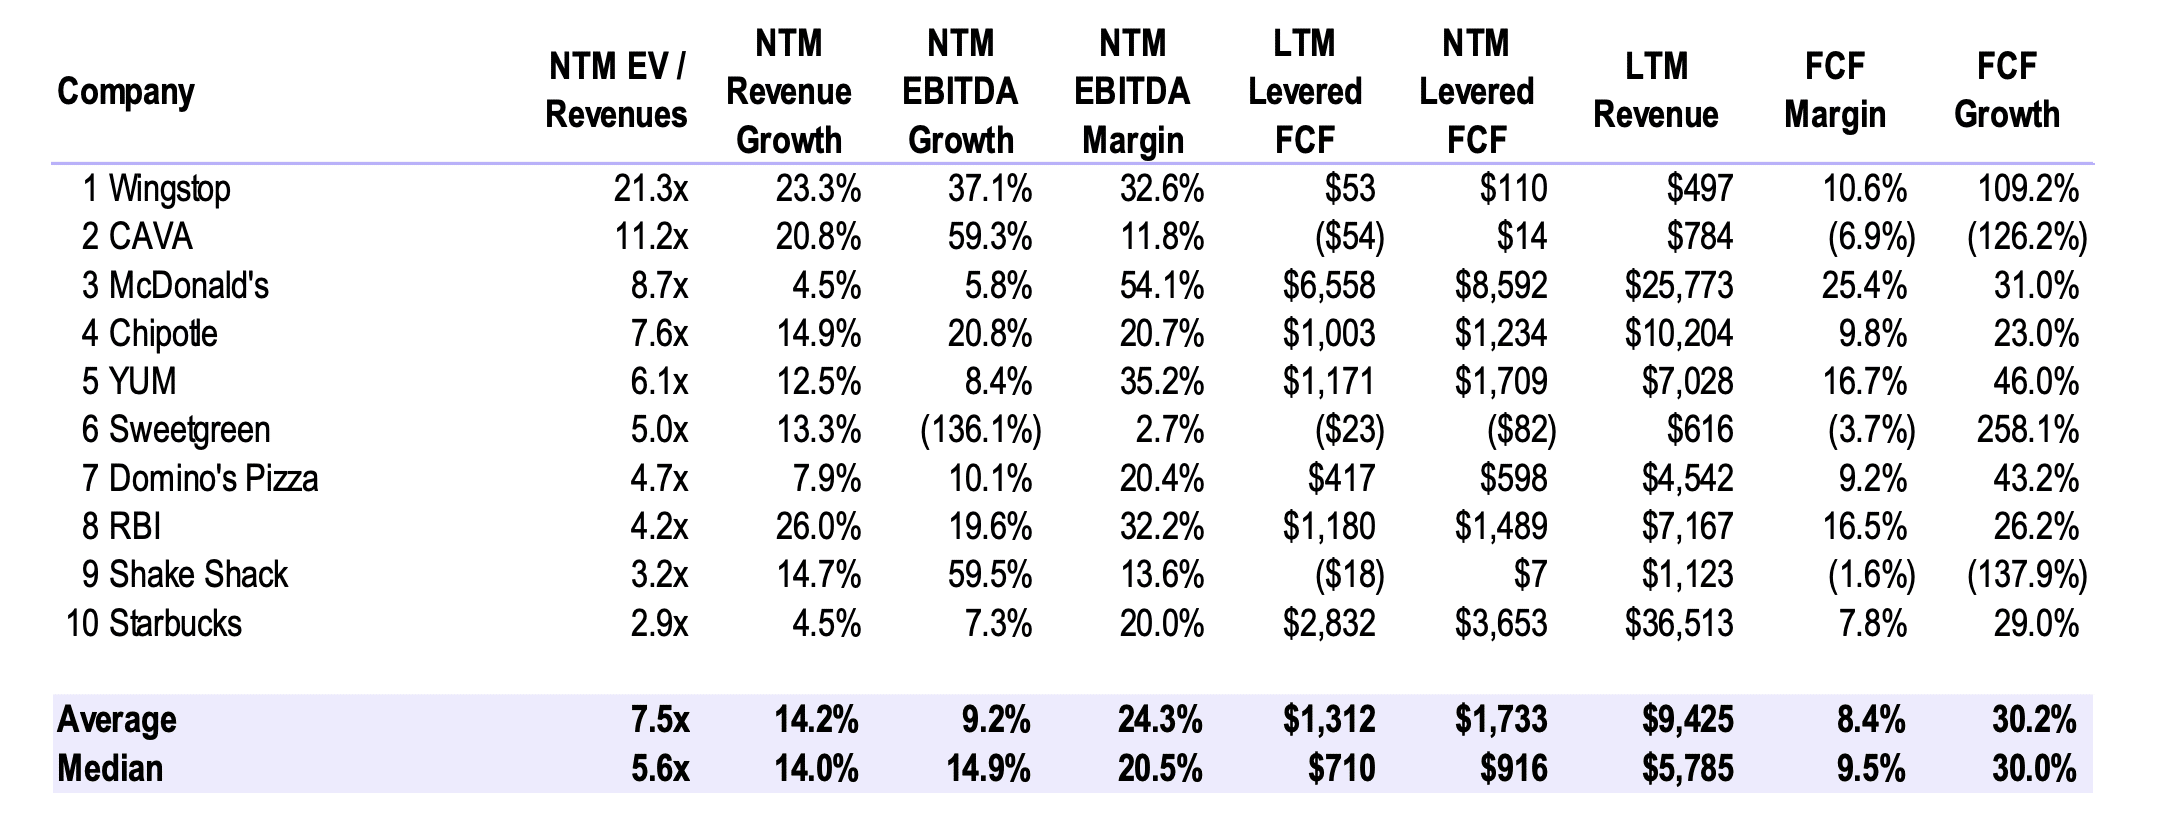
Top 10 Enterprise Value [EV] / NTM Revenue Multiples
The top 10 is made up of mostly Franchisor entities, which have higher multiples than company owned concepts. Consensus revenue growth forecasts estimate ~10% growth into 2024. The growth guidance is attributable to store growth and price increases.
Source: TIKR, Paperchase
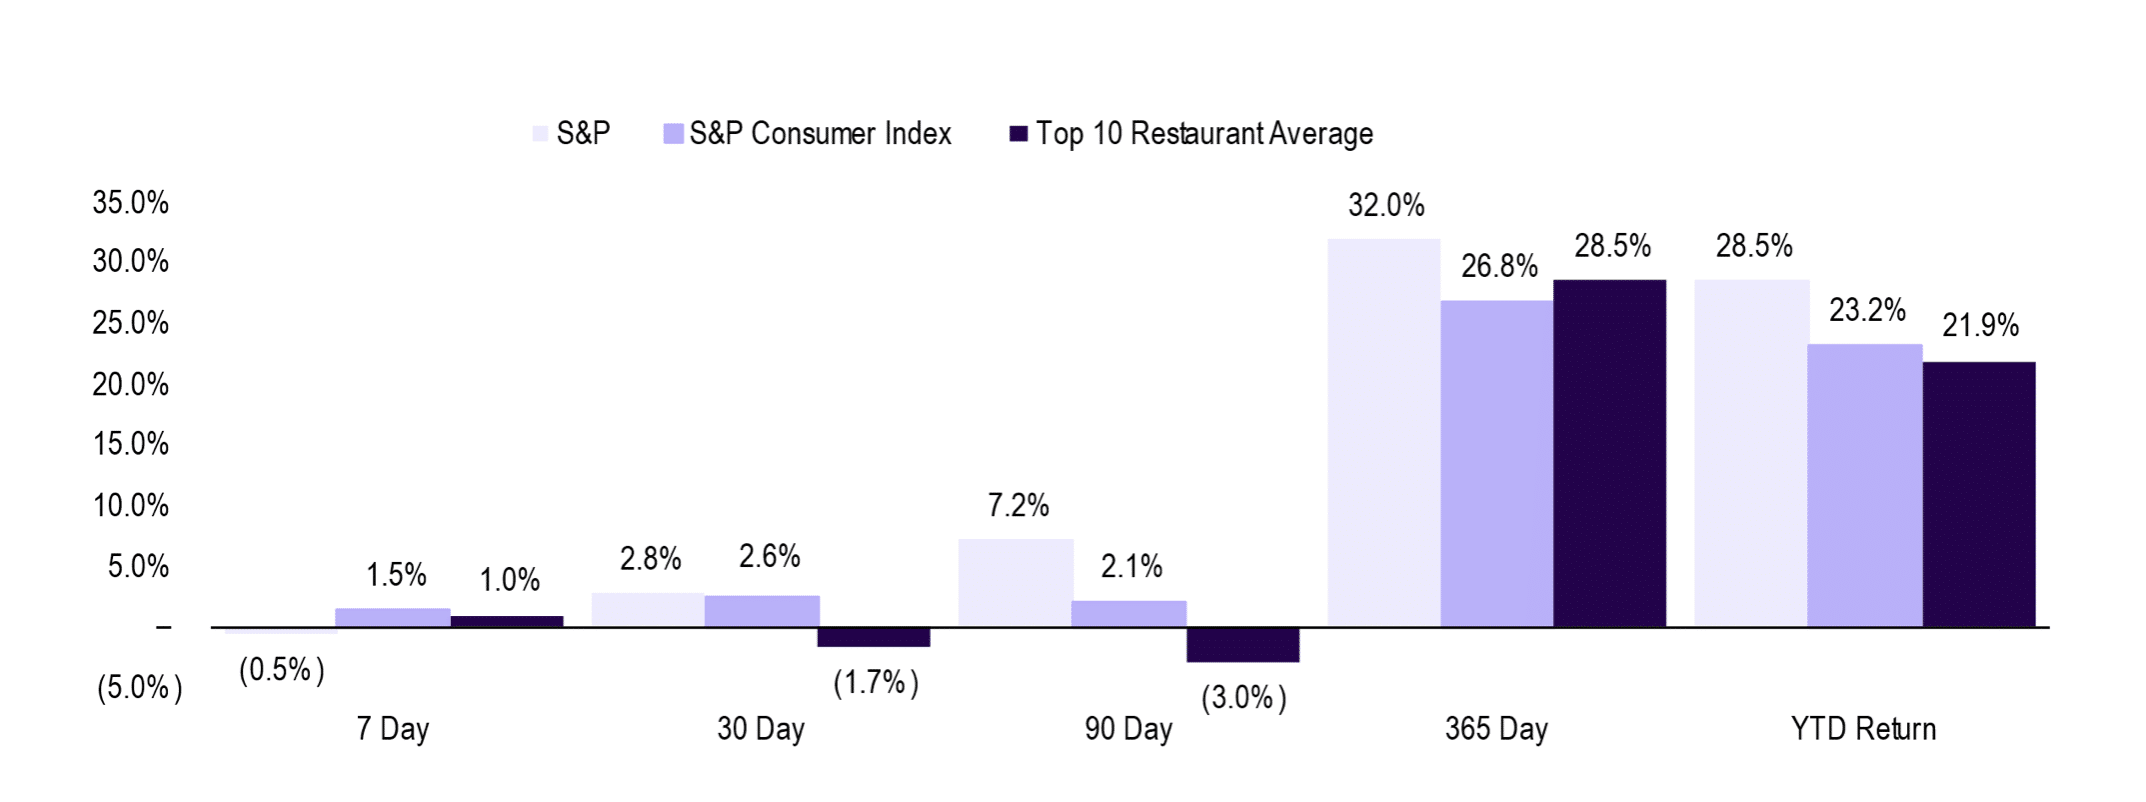
This Top 10 cohort has outperformed the S&P and S&P Consumer index over the last year.
Source: TIKR, S&P, Paperchasee
Public Comps – Trends
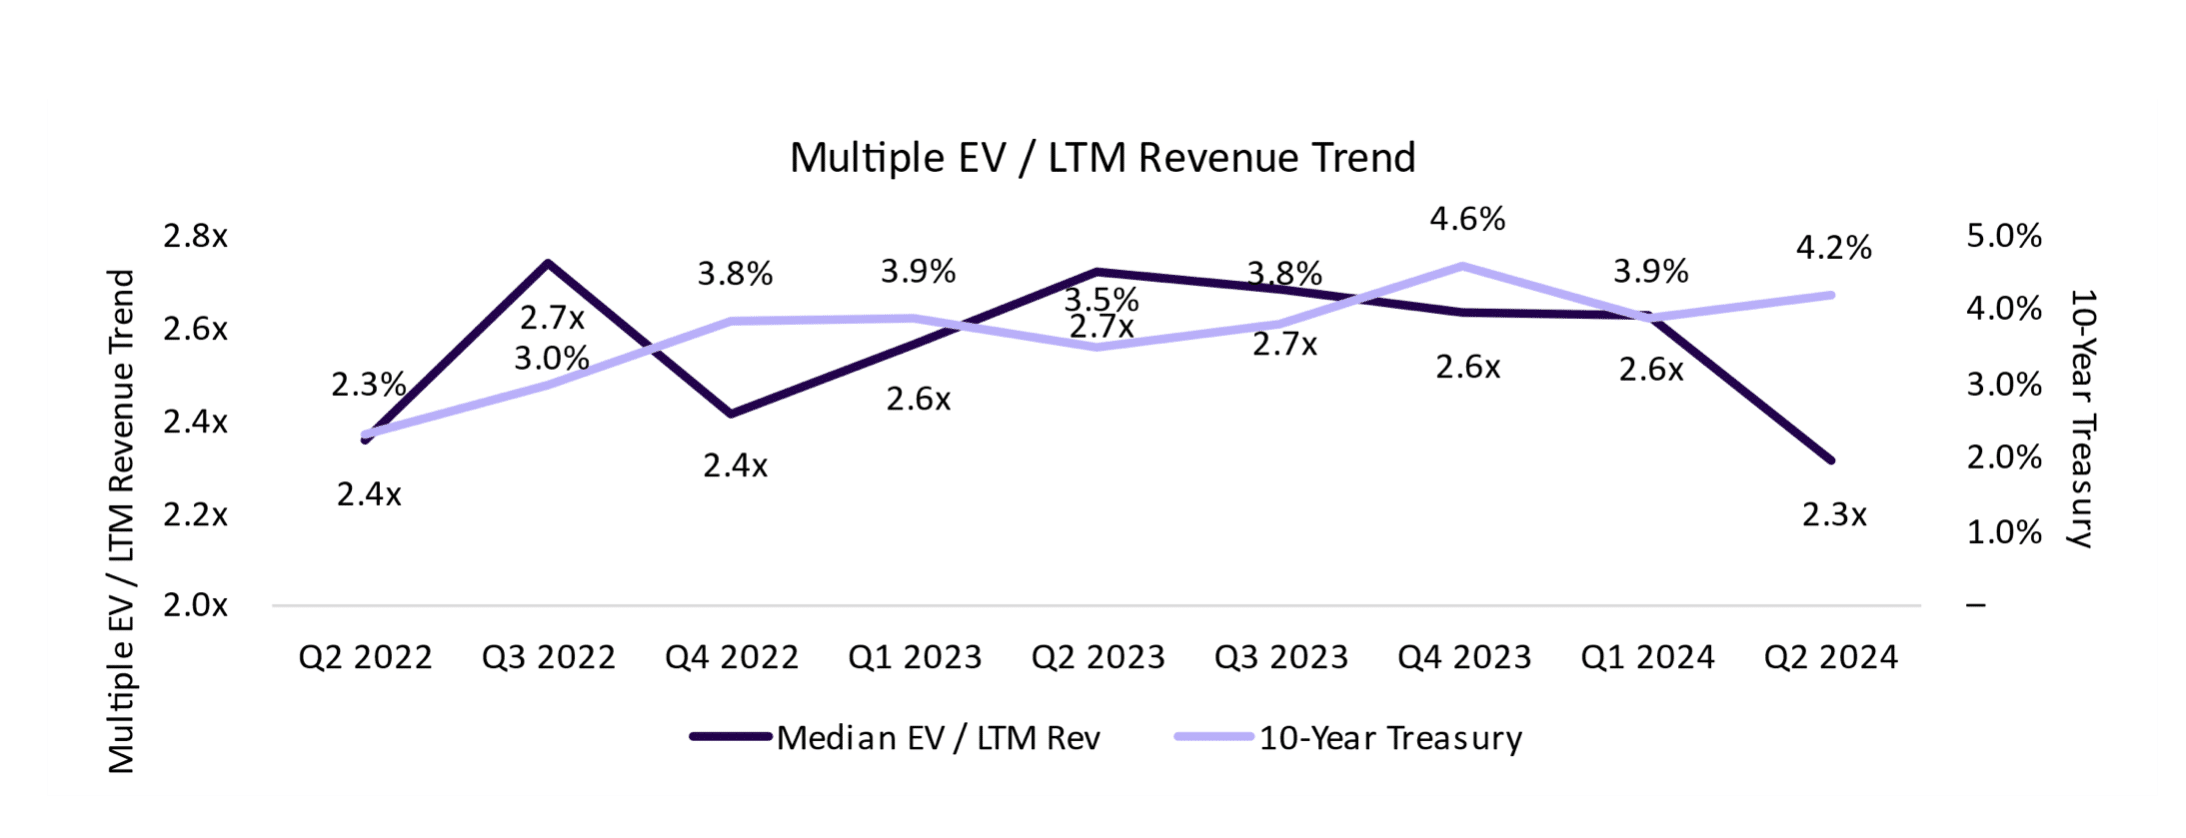
Trend – Enterprise Value [EV] / LTM Revenue Multiples
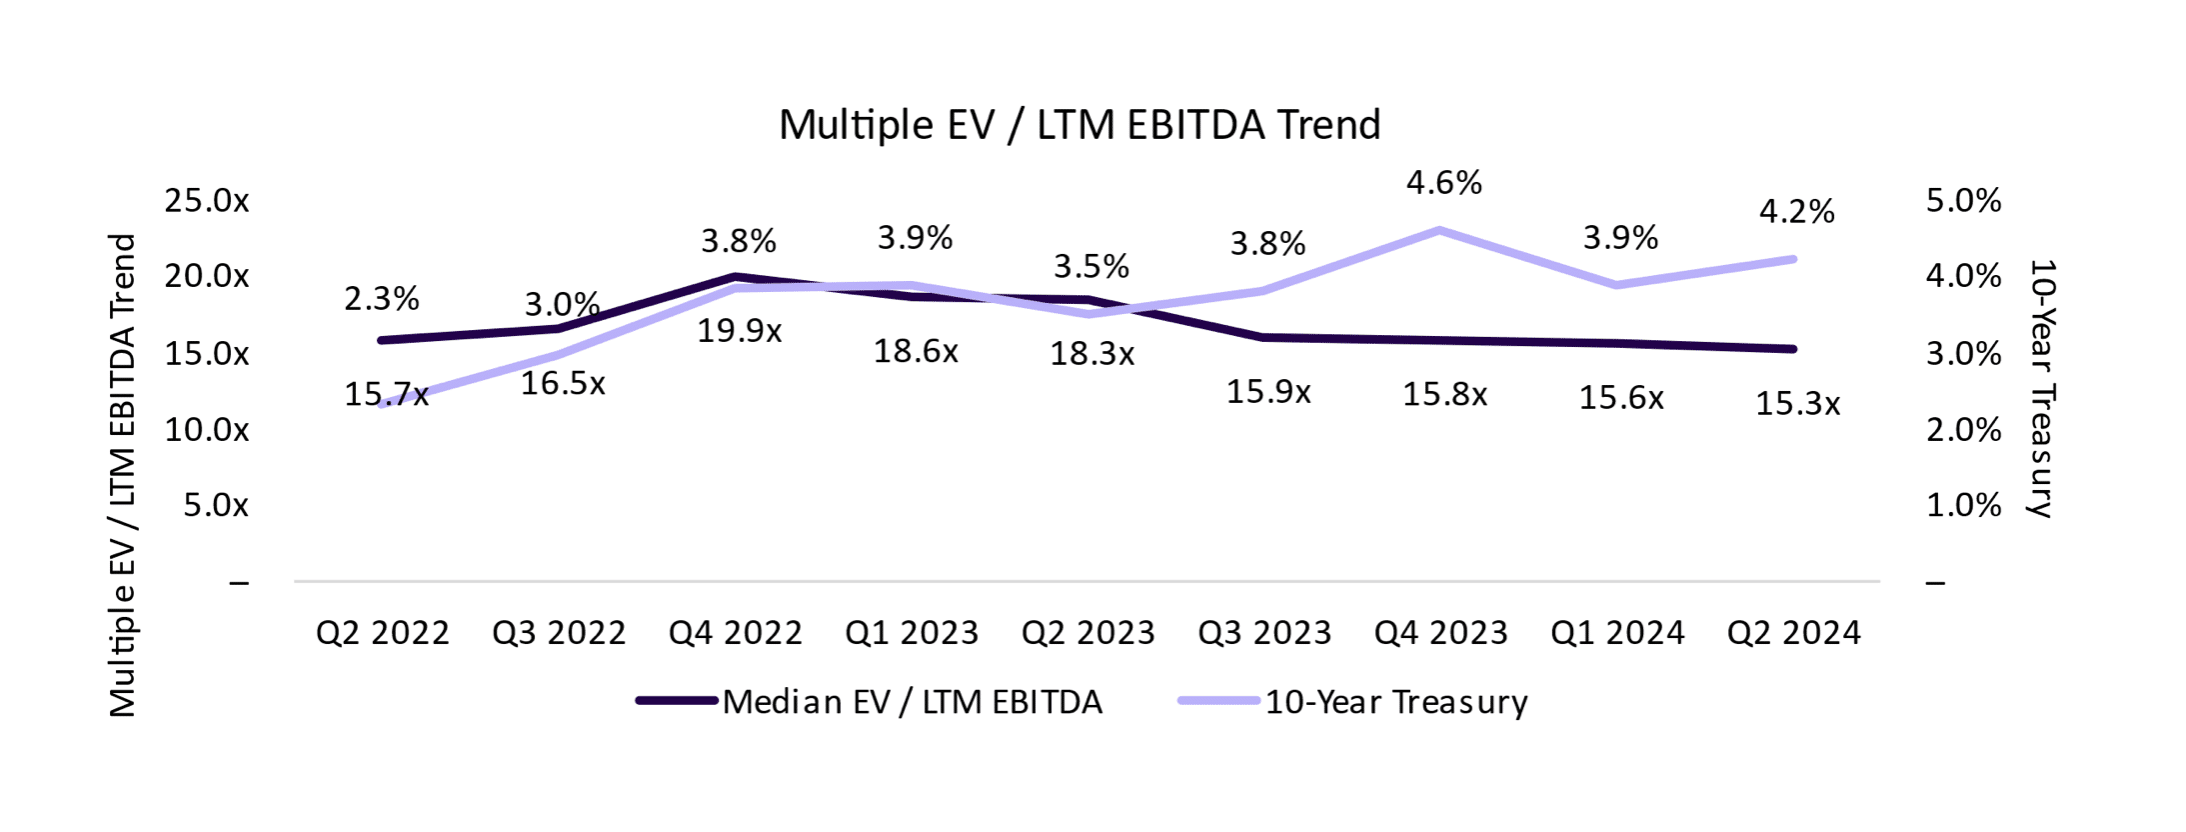
The restaurant industry has seen valuations decline due to interest rate increases.
Trend – Enterprise Value [EV] / LTM EBITDA Multiples
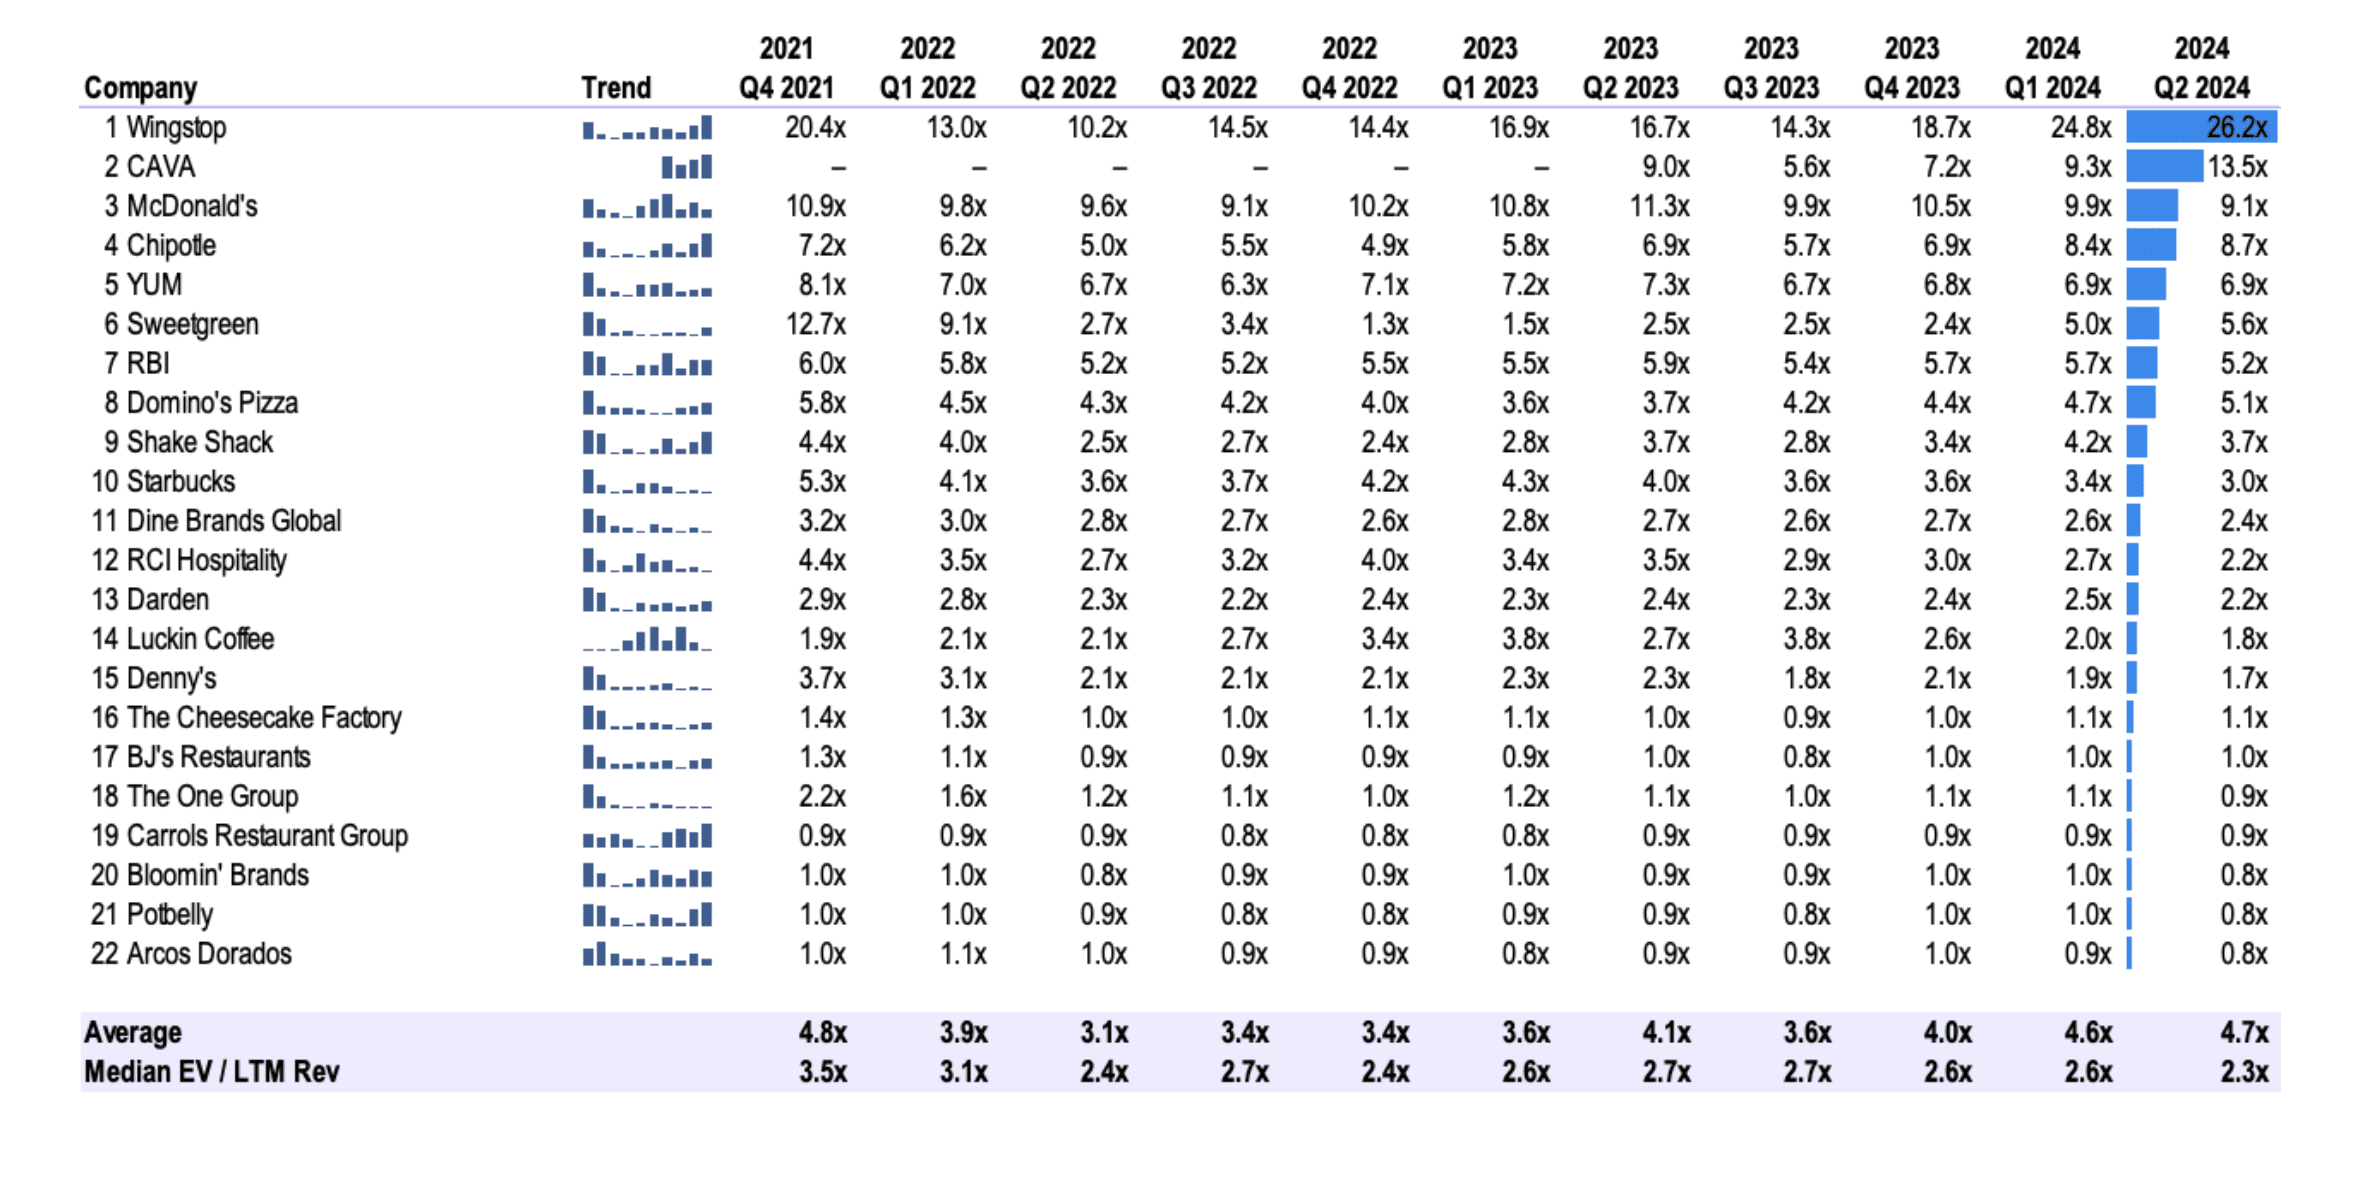
Revenue Multiple Trends
Restaurant businesses are generally valued on multiples of their revenue or EBITDA, depending on their capital structure, growth potential, and franchise model. For example, a McDonald’s franchise has a higher revenue multiple than a company-owned restaurant chain like Shake Shack.
Here are some of the factors that affect restaurant valuation multiples:
- Capital structure: Businesses with less debt and more equity tend to have higher valuation multiples.
- Growth potential: Businesses with high growth potential tend to have higher valuation multiples.
- Franchise potential: Franchise businesses tend to have higher valuation multiples than company-owned businesses.
EBITDA Multiple Trends


Sources
TIKR
Bloomberg
Company 10-Q and 10-K Filings
Restaurant Business
Bureau of Labor Statistics (BLS) [bls.gov]
U.S. Bureau of Economic Analysis (BEA) [bea.gov]
U.S. Department of Agriculture (USDA) Economic Research Service [ers.usda.gov]
Federal Reserve Economic Data (FRED) [fred.stlouisfed.org]
National Restaurant Association [restaurant.org]
International Monetary Fund (IMF) [imf.org]
Disclaimer
The information provided is believed to be from reliable sources, but no liability is accepted for any inaccuracies. This is for information purposes and should not be construed as an investment recommendation. Past performance is no guarantee of future performance.
This post and the information presented are intended for informational purposes only. The views expressed herein are the author’s alone and do not constitute an offer to sell, or a recommendation to purchase, or a solicitation of an offer to buy, any security, nor a recommendation for any investment product or service. While certain information contained herein has been obtained from sources believed to be reliable, neither the author nor any of his employers or their affiliates have independently verified this information, and its accuracy and completeness cannot be guaranteed. Accordingly, no representation or warranty, express or implied, is made as to, and no reliance should be placed on, the fairness, accuracy, timeliness, or completeness of this information. The author and all employers and their affiliated persons assume no liability for this information and no obligation to update the information or analysis contained herein in the future.


